Operations & Jobs
Almost everything in Obscura is asynchronous. Scans, probes, fingerprints, previews, HLS transcodes, identify runs, image thumbnails, audio waveforms — they're all jobs handled by a background worker (apps/worker) backed by pg-boss. The Operations page (sidebar → Jobs) is your window into that work.
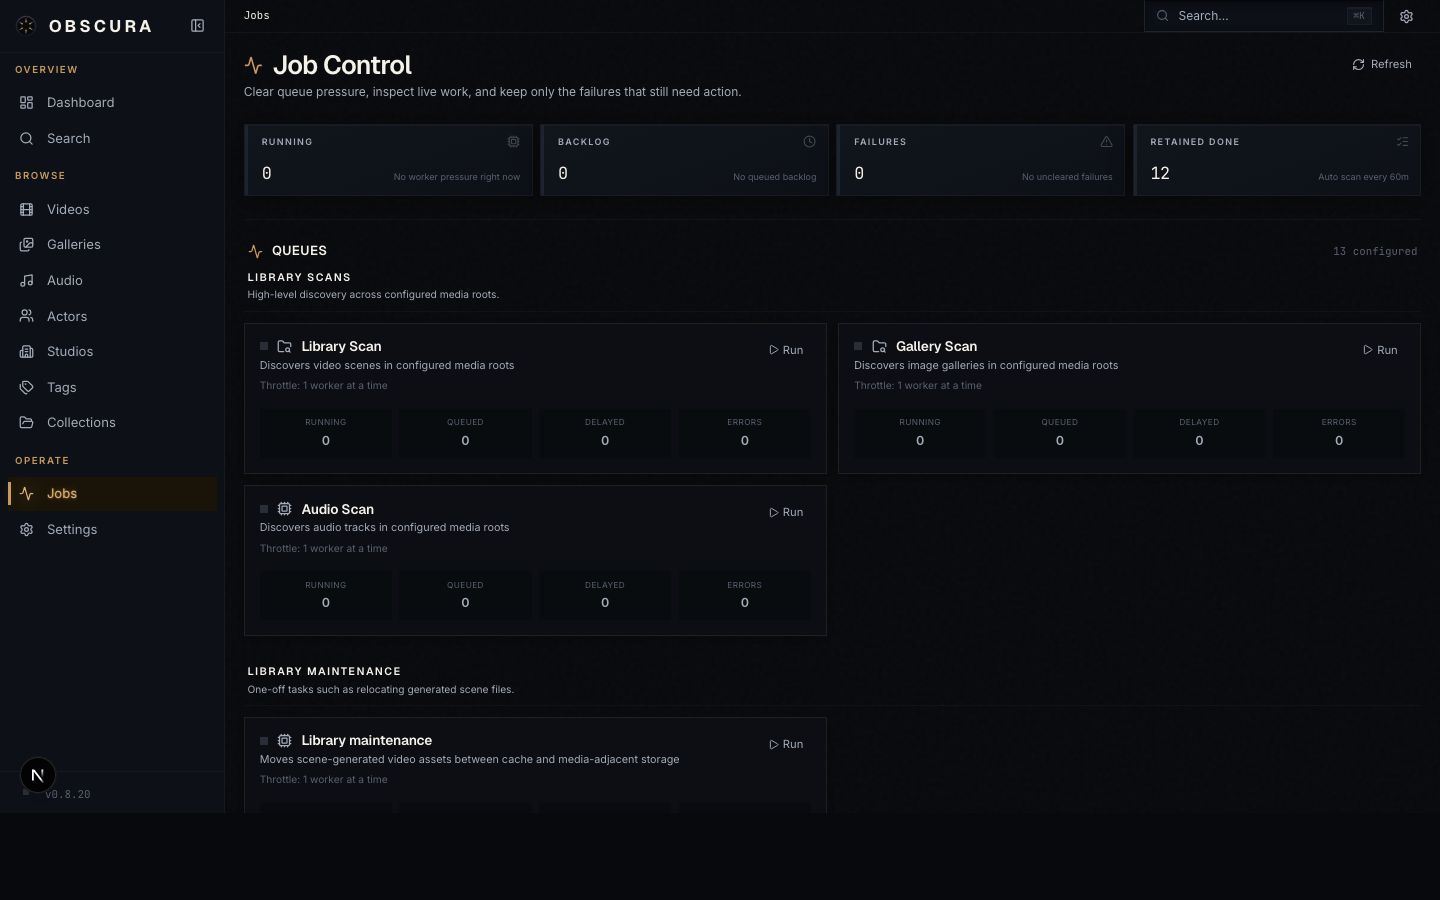
The four-up overview
The top of the page is a 2×2 stat grid:
| Stat | Meaning |
|---|---|
| Running | Jobs currently being processed by the worker. |
| Backlog | Jobs waiting in pg-boss queues, including delayed retries. |
| Failures | Failed job-runs that haven't been cleared. |
| Retained Done | Recently-finished jobs kept in the job_runs ledger, plus the auto-scan schedule. |
These numbers refresh every 5 seconds. Hit Refresh for an immediate update.
Queues, grouped by concern
Below the overview, queues are grouped into sections so you can find what you need without scanning a long list:
| Section | Queues |
|---|---|
| Library scans | library-scan, gallery-scan, audio-scan |
| Library maintenance | library-maintenance (move assets, dedupe paths) |
| Video media pipeline | media-probe, fingerprint, preview, extract-subtitles |
| Metadata import | metadata-import (apply identify results) |
| Gallery image pipeline | image-thumbnail, image-fingerprint |
| Audio pipeline | audio-probe, audio-fingerprint, audio-waveform |
| Collections | collection-refresh (re-evaluate dynamic rules) |
Each queue card shows:
- The queue name and a one-line description
- Live counts: running, backlog, failed
- Run button — enqueue pending work for this queue
- Cancel button — cancel everything currently in this queue
- Clear failures button — clear the failed-job list for this queue
Live work
Below the queue grid, a Live Work section lists individual active jobs:
- Job type (e.g. "Generate video preview")
- Progress bar where the worker reports progress
- Per-job Cancel button
- Section-level Kill all button when there's anything running
This is where you watch a long-running scan happen.
Failures
Failed jobs land in the Failures section with their full error message. Use this to triage:
- Common case: a corrupt file. The relevant job logs the file path; you can open it on disk and decide whether to fix or remove.
- Generation issues: a missing codec, an unreadable container, ffmpeg crash. The error is verbatim from the worker.
Click Clear all (global or per-queue) to acknowledge failures and remove them from the active list. The job-run rows stay in the database (status failed) for forensic reading, just not in the dashboard count.
Recently finished
A retained list of recently-completed jobs at the bottom. Useful when you want to confirm "yes, that scan finished" or check timing.
Running a scan manually
Even with auto-scan enabled, you'll often want to kick off a scan explicitly — after adding files, after tweaking a library root, after recovering from a breaking-gate.
- Open Operations.
- Find the Library scan queue card.
- Click Run.
The card shows "Enqueued N, skipped M" — N new scan jobs were created (one per enabled scan type per library root); M were already pending. The scan jobs flow into the worker, discover files, and enqueue the downstream pipeline jobs (probe → fingerprint → preview).
Galleries and audio have their own scan buttons in the same way (gallery-scan, audio-scan).
Killing runaway work
Two scopes:
| Action | Scope |
|---|---|
| Cancel on a queue card | All jobs in that queue (running + waiting). |
| Kill all in the Live Work header | Every running job, all queues. |
| Cancel on an individual job | Just that one job. |
Cancelled jobs land in the failures list with status cancelled — useful trail when you want to know what got stopped.
Auto-scan
The Retained Done stat shows your auto-scan schedule next to the count. Configure it in Settings → Watched Libraries:
- Auto-scan enabled — toggle.
- Scan interval (minutes) — frequency. Default 60.
When enabled, the worker schedules library scans on the configured cadence. Auto-scan runs the Library scan queue with the same effect as clicking Run manually.
Worker concurrency
Each queue has a per-queue concurrency setting. By default, every queue runs one job at a time — Obscura prefers steady throughput over maximizing parallel CPU on a single user's box.
To allow more parallelism, raise Background worker concurrency in Settings → Watched Libraries. The setting is a global multiplier applied to each queue's base concurrency, capped between 1 and 16.
Heavier setting = more wall-clock progress, more CPU use, more I/O contention. Pick what your hardware can carry.
NSFW visibility
When NSFW mode is Off, jobs targeting NSFW entities are hidden from every list on this page. They still run; they just don't appear in the dashboard. Switch NSFW mode to Show to see everything.
Where this data lives
If you want to read job state outside the UI:
job_runstable — the source of truth for the dashboard. One row per job execution (id, queueName, bullmqJobId, status, targetType, targetId, targetLabel, progress, attempts, payload, error, startedAt, finishedAt).pgboss.*schema — pg-boss's internal state. You generally shouldn't poke this directly; the wrapper inpackages/app-core/src/queue-writes.tsis the supported API.
-- Recent failures across all queues
SELECT queue_name, target_label, error, finished_at
FROM job_runs
WHERE status = 'failed'
ORDER BY finished_at DESC
LIMIT 20;
When the dashboard is misleading
A handful of things to know:
- Long-running jobs (e.g. a 4K video preview generation) won't show progress unless the underlying job emits it. The job is fine; the bar just stays at 0%.
- Backlog jumps after a fresh scan are normal — discovering files cascades into many downstream jobs.
- Failure counts include retries that exhausted their attempts, not transient errors. pg-boss retries with exponential backoff up to ~15 attempts before marking a job permanently failed.